| Top | / | Flight | / | F1 | / | Travel | / | Backyard | / | PC | / | Map | / | US-Life | / | History |
| Description | Price | Qty | Total |
| P4-3.2GHz 800MHz FSB | $394.00 | 1 | $394.00 |
| P4-2.8GHz 800MHz FSB | $265.00 | 1 | $265.00 |
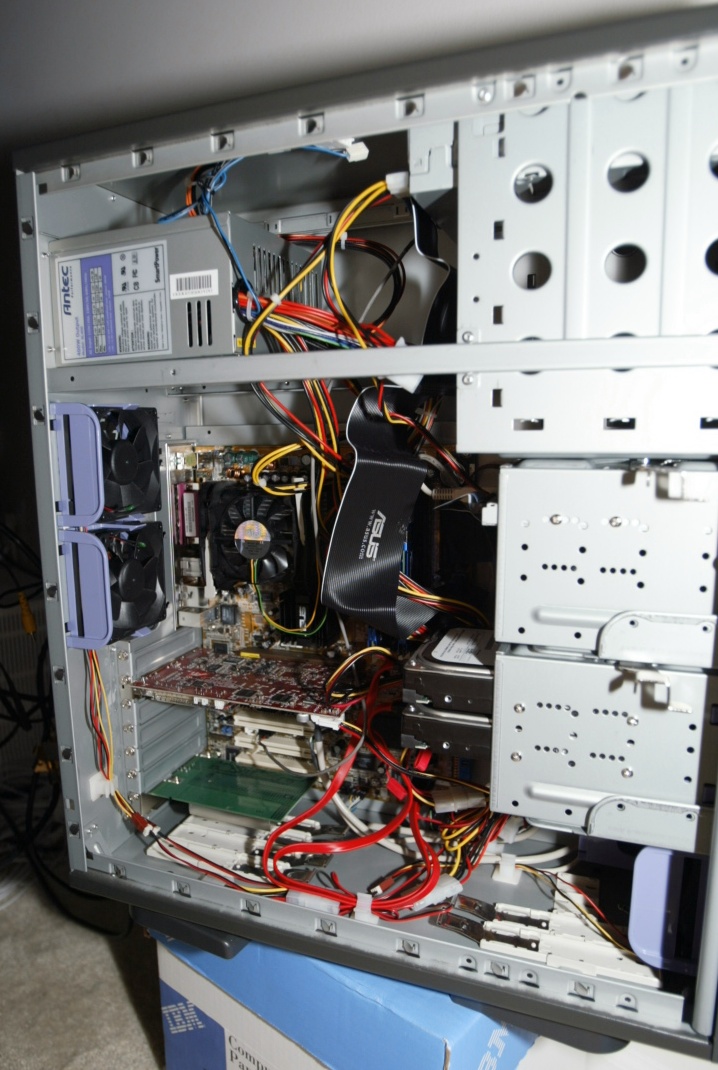
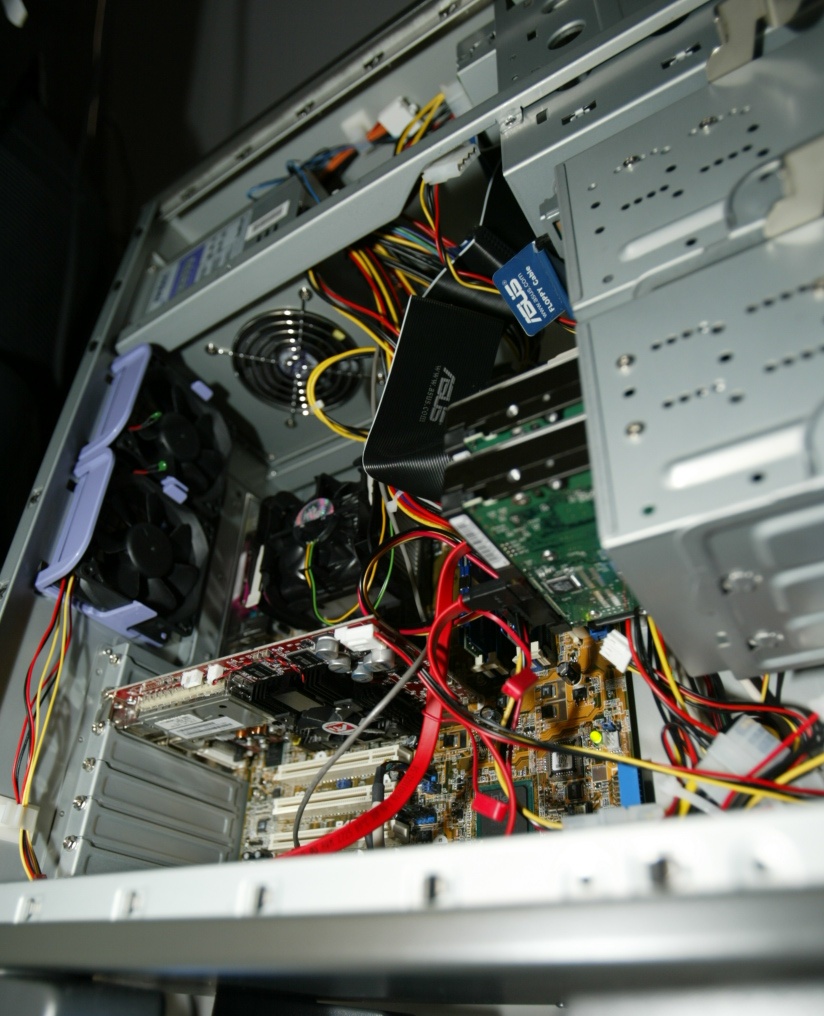
| Kingston KHX3500/256 256MB PC3500 | $66.00 | 2 | $132.00 |
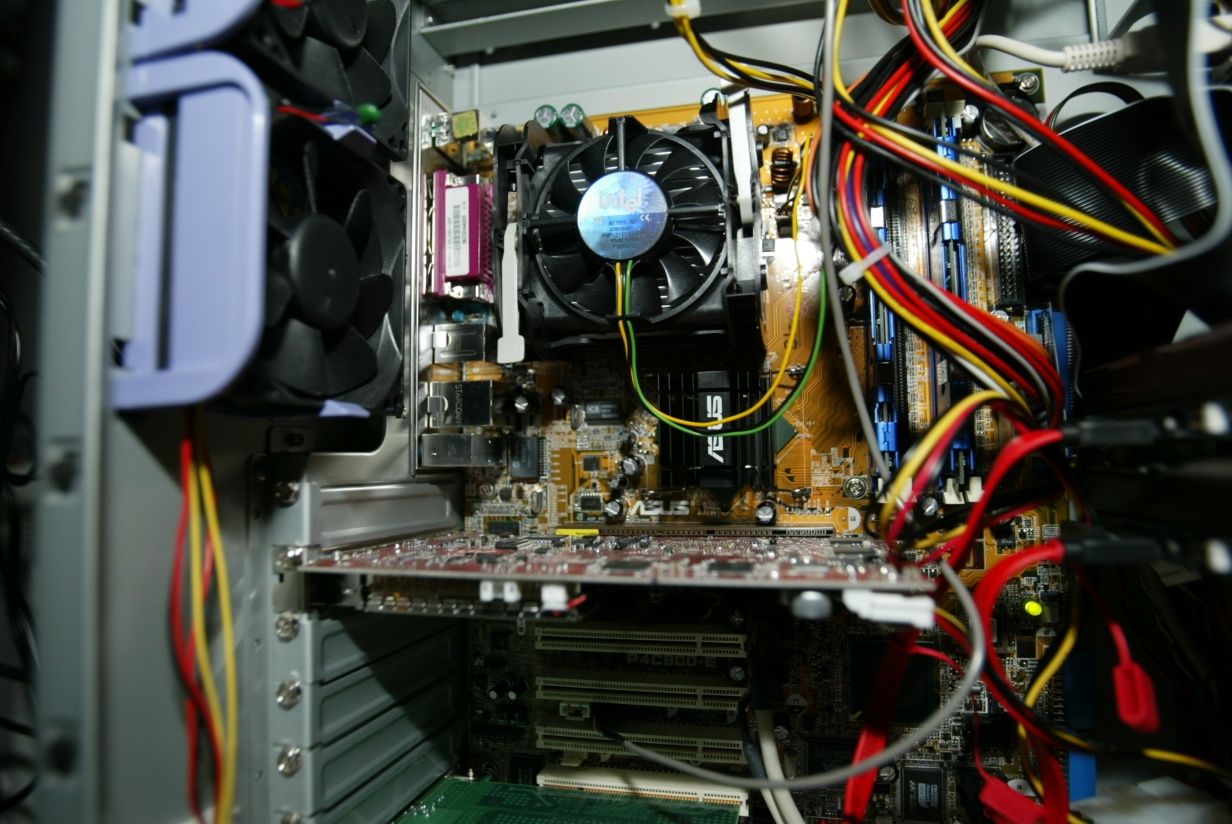
| ASUS P4C800-E Deluxe | $192.99 | 1 | $192.99 |
| Raptor Enterprise WD360GD S-ATA 36.7GB 10000RPM 8MB | $133.00 | 2 | $266.00 |
| All In Wonder 9700 Pro AGP 128MB | $346.00 | 1 | $346.00 |
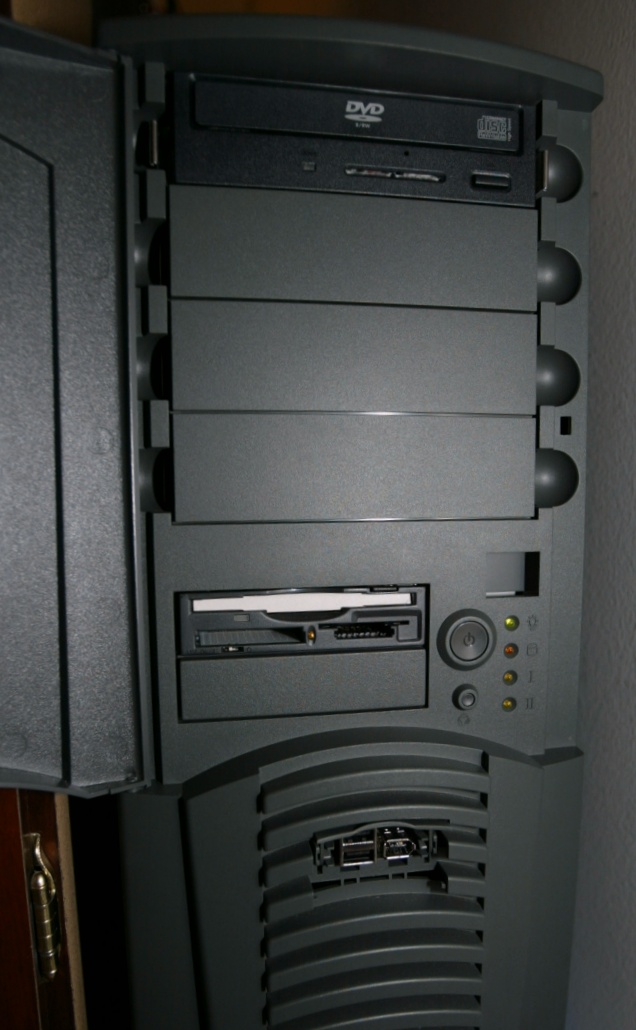
| FD | $13.99 | 1 | $13.99 |
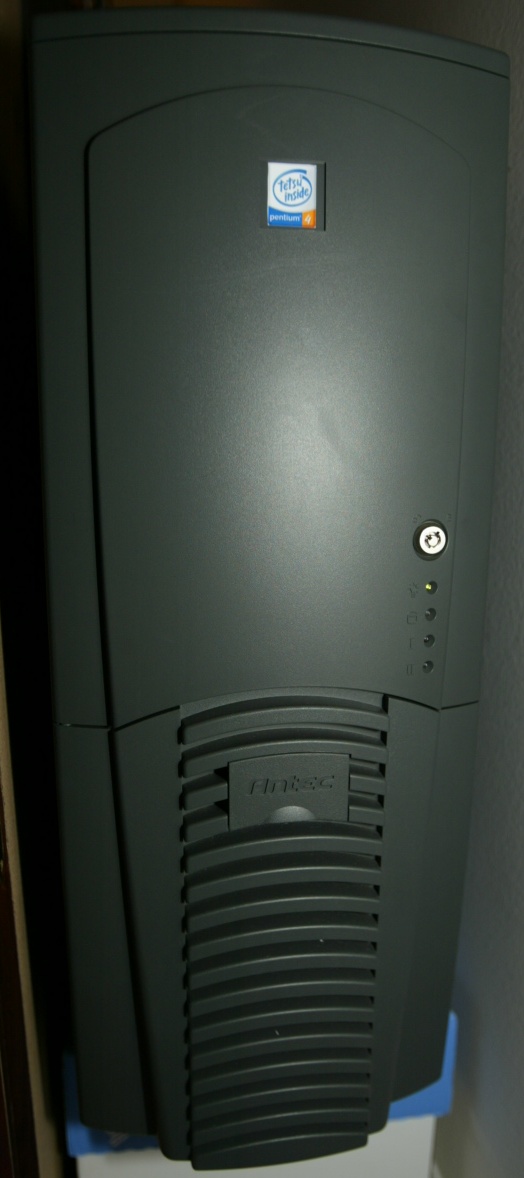
| Antec SX1040BII Performance Series II with 420W | $85.99 | 1 | $85.99 |
| Total | $1,430.97 |
| P4-2.8C | P4-3.2C | ||||||||||
| HDBENCH | BIOS1006 | BIOS1010 | PAM | Turbo | PAM&Turbo | OC5% | OC5% PAM | OC5% Turbo | OC5% PAM&Turbo | OC10% | Normal |
| ALL | 67594 | 64266 | 64245 | 66804 | 67775 | 64516 | 67170 | 66760 | 66650 | 61266 | 70044 |
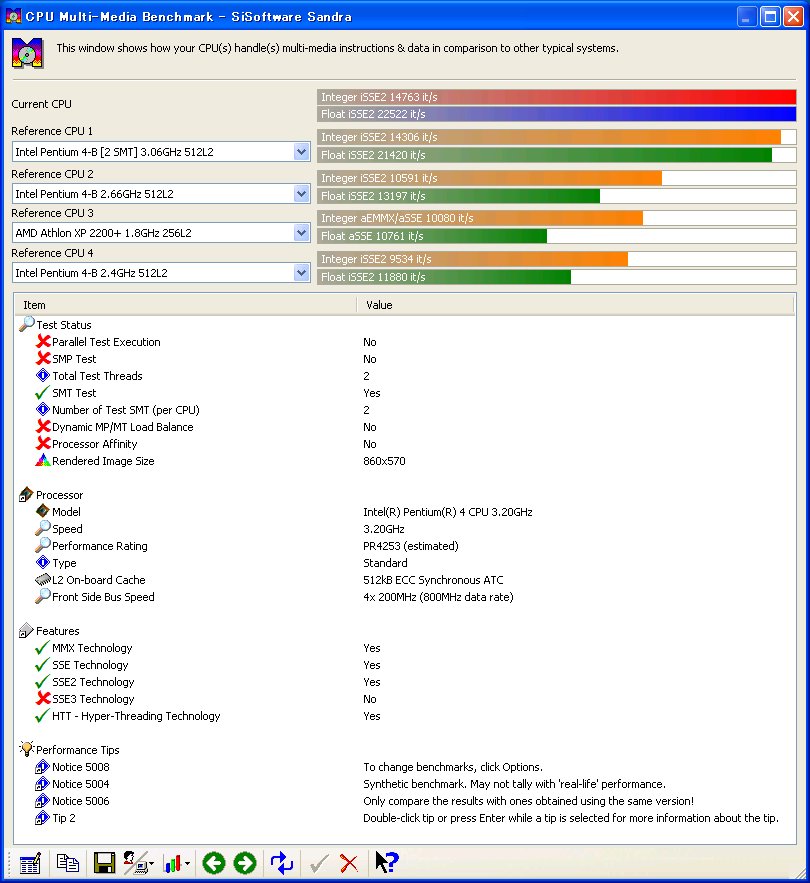
| Integer | 86677 | 86678 | 86641 | 86643 | 86386 | 91021 | 91022 | 91020 | 91020 | 95349 | 99035 |
| Float | 107006 | 107414 | 106771 | 107363 | 107695 | 112939 | 113088 | 112933 | 112754 | 118206 | 122412 |
| Read | 239564 | 240025 | 242278 | 261119 | 261580 | 250777 | 267366 | 269055 | 255078 | 216216 | 265318 |
| Write | 72316 | 73419 | 74435 | 95561 | 96204 | 76031 | 84991 | 85862 | 83506 | 55755 | 95128 |
| ReadWrite | 153947 | 152268 | 155852 | 196812 | 196324 | 154418 | 173772 | 182041 | 172133 | 117472 | 194251 |
| Rectangle | 63400 | 65600 | 66600 | 66200 | 63600 | 68000 | 68400 | 68951 | 67000 | 69544 | 67945 |
| Text | 16773 | 17386 | 16600 | 17200 | 17372 | 17718 | 17773 | 17400 | 17744 | 17973 | 23527 |
| Tellipse | 10780 | 11380 | 11252 | 11510 | 11570 | 11800 | 11720 | 11740 | 11740 | 11880 | 11300 |
| BitBlt | 771 | 781 | 781 | 781 | 781 | 781 | 781 | 781 | 781 | 781 | 775 |
| DirectDraw | 59 | 59 | 59 | 59 | 59 | 59 | 59 | 59 | 59 | 59 | 74 |
| Read | 81854 | 77050 | 77989 | 71210 | 78890 | 71960 | 77989 | 73563 | 78890 | 71960 | 78890 |
| Write | 114798 | 100688 | 100688 | 100688 | 100787 | 99224 | 100688 | 97803 | 100787 | 99224 | 100688 |
| RandomRead | 14825 | 20225 | 17241 | 16931 | 17426 | 17106 | 16463 | 16381 | 16463 | 16759 | 18002 |
| RandomWrite | 40442 | 25793 | 25696 | 25799 | 26003 | 26102 | 25296 | 25799 | 26003 | 25498 | 25696 |
| SANDRA | |||||||||||
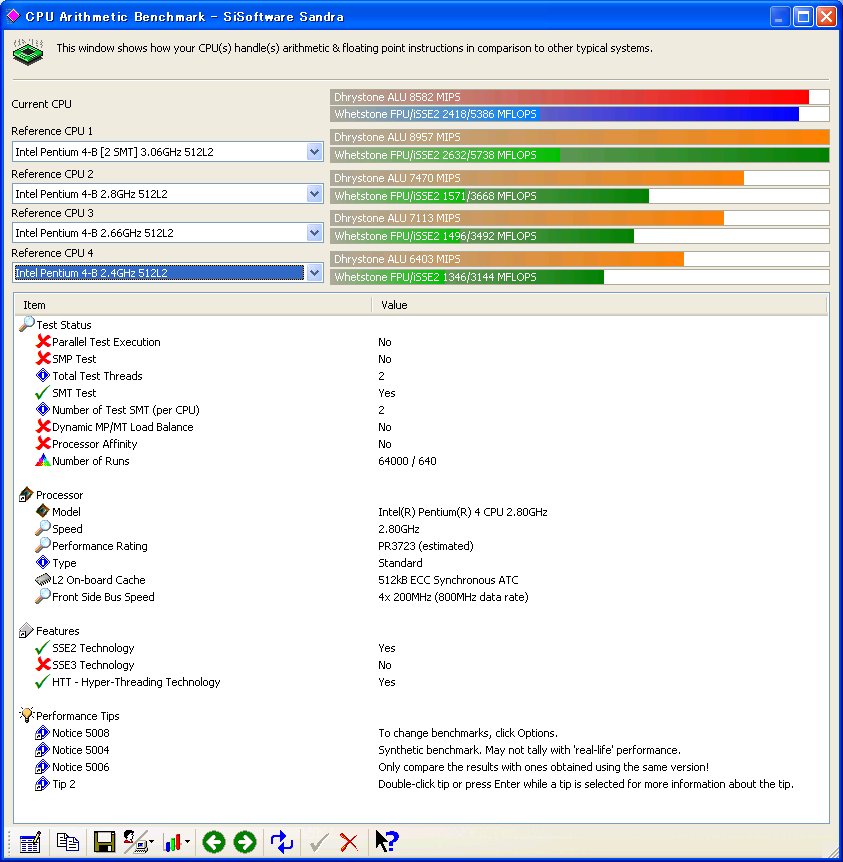
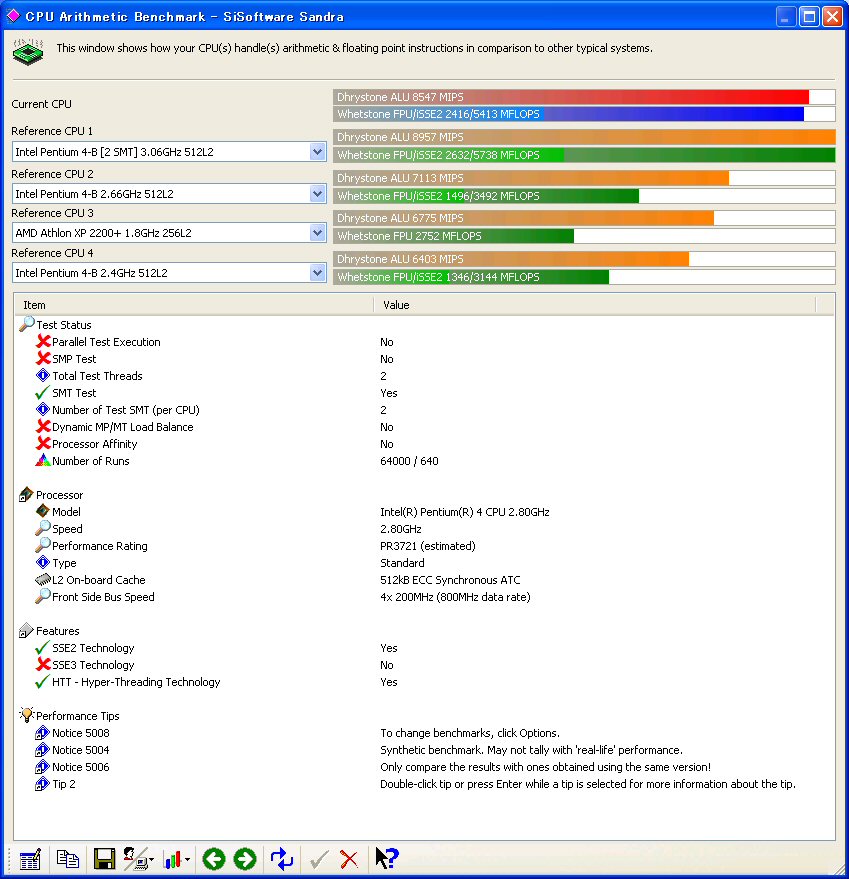
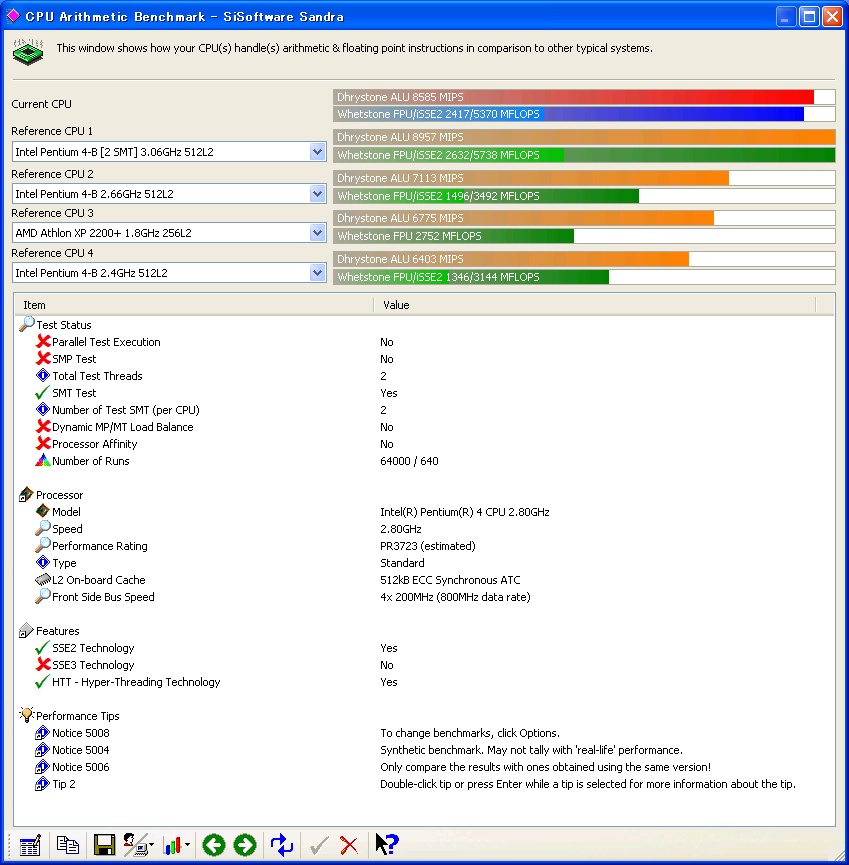
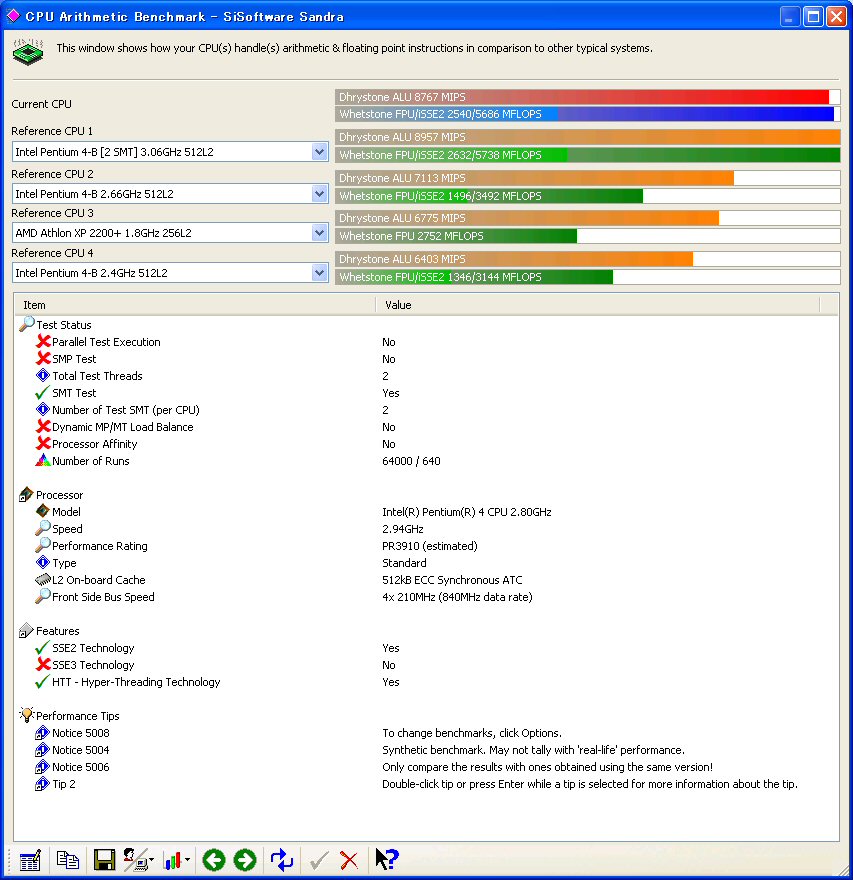
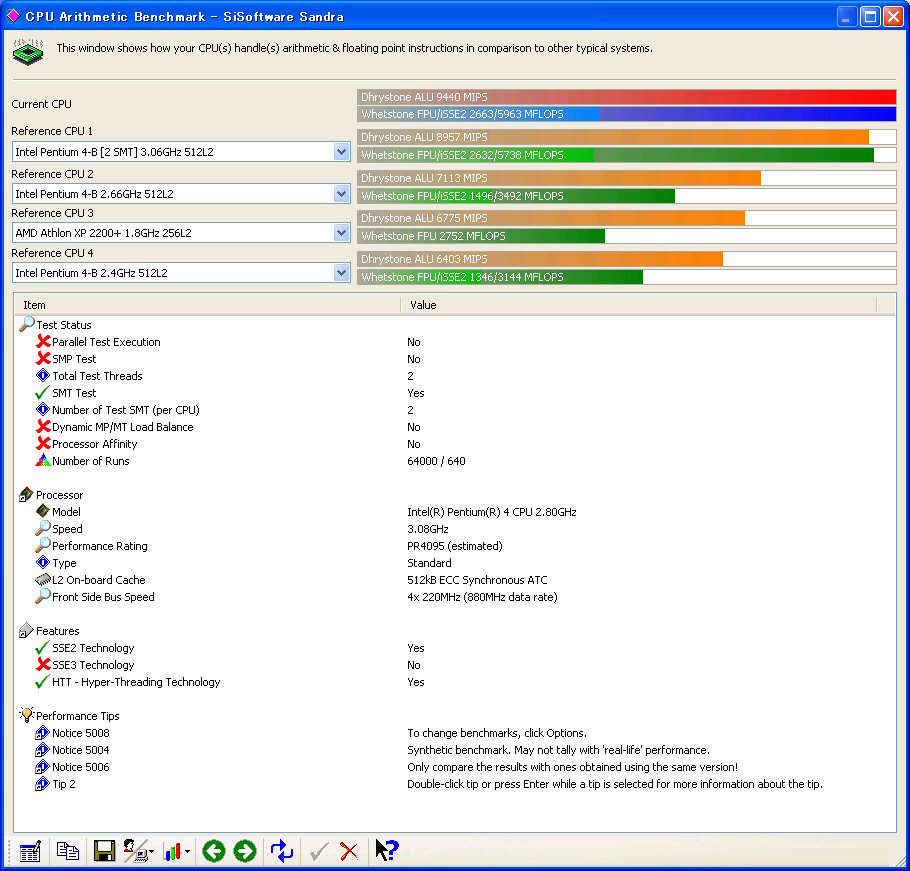
| Dhrystone ALU (MIPS) | 8582 | 8546 | 8547 | 8549 | 8585 | 8767 | 9023 | 9102 | 9021 | 9440 | 9869 |
| Whetstone FPU (MFLOPS) | 2418 | 2418 | 2416 | 2420 | 2417 | 2540 | 2541 | 2542 | 2543 | 2663 | 2767 |
| Whetstone iSSE2 (MFLOPS) | 5386 | 5423 | 5413 | 5411 | 5370 | 5686 | 5691 | 5694 | 5699 | 5963 | 6166 |
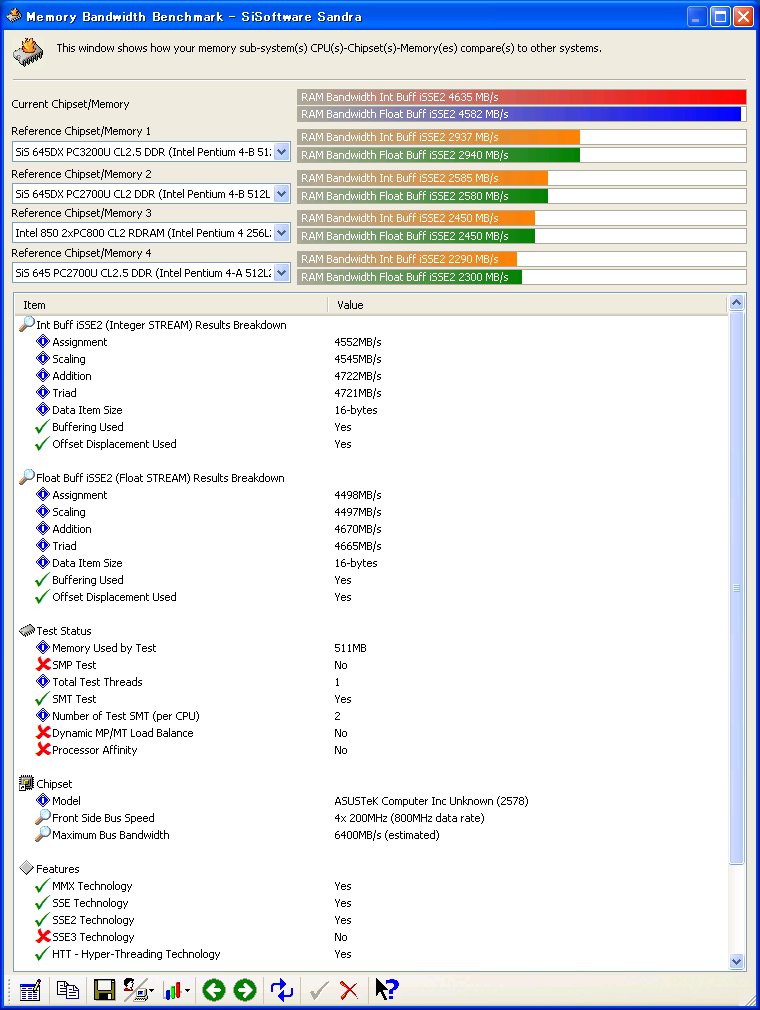
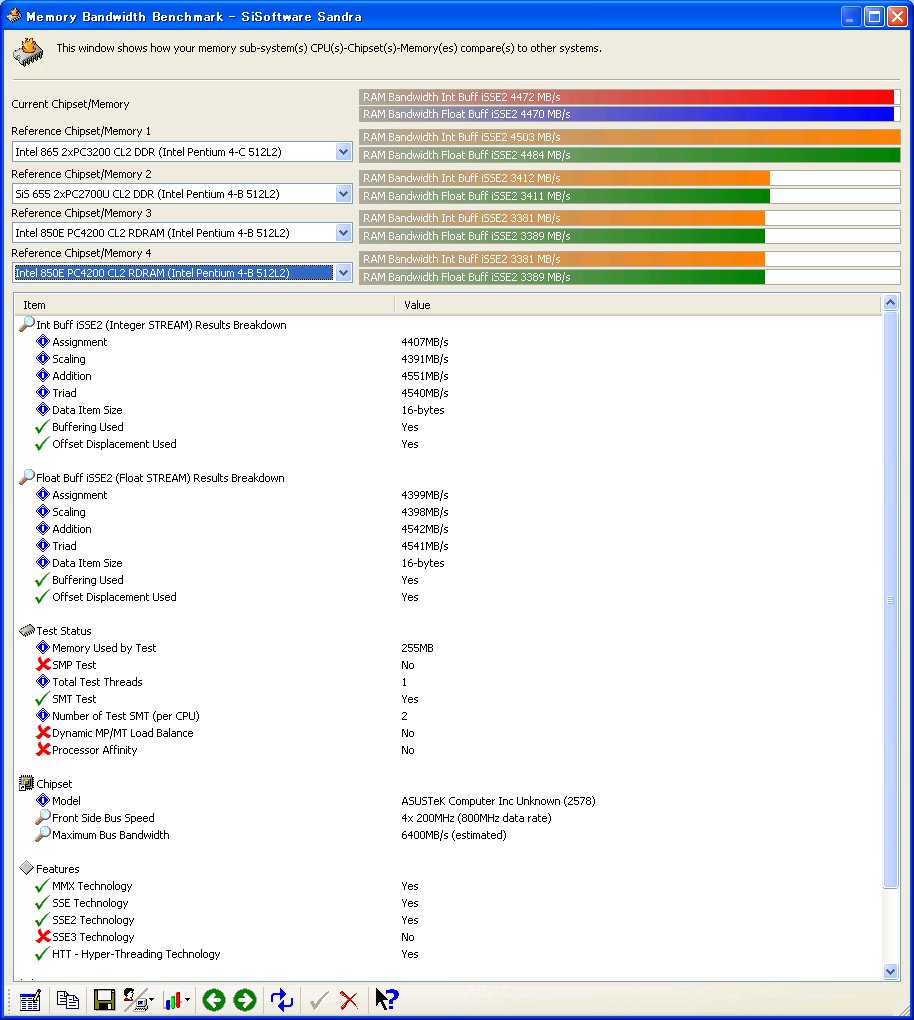
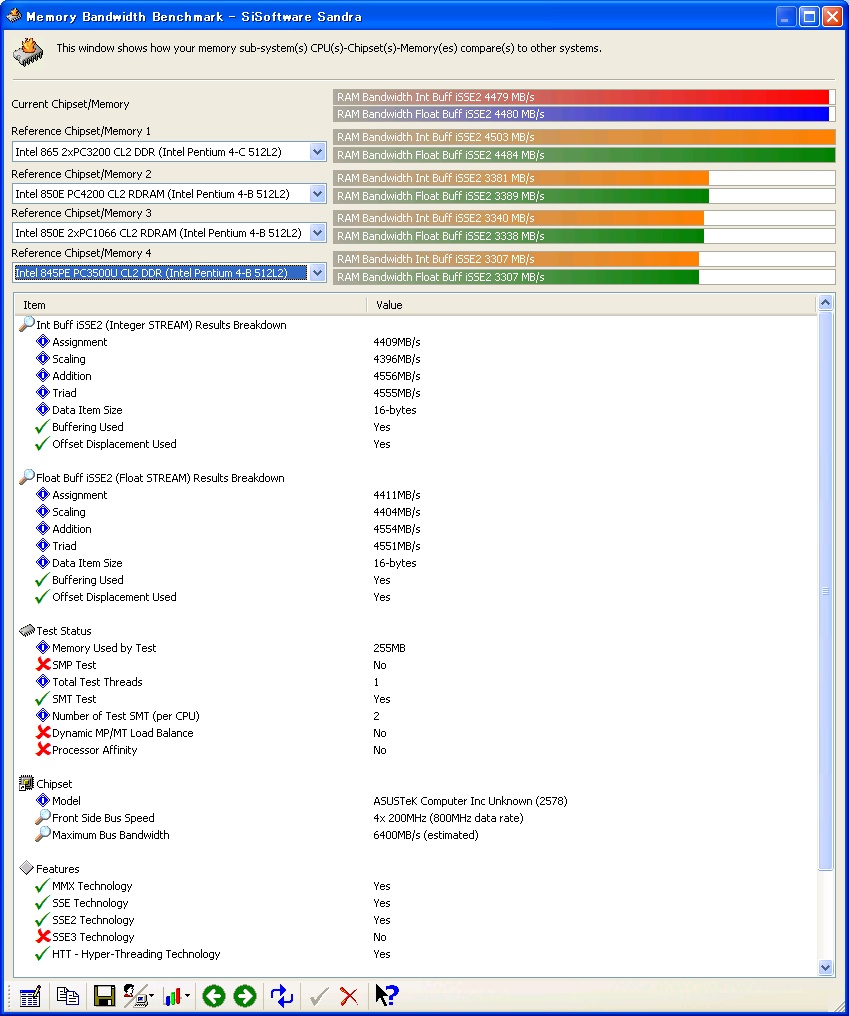
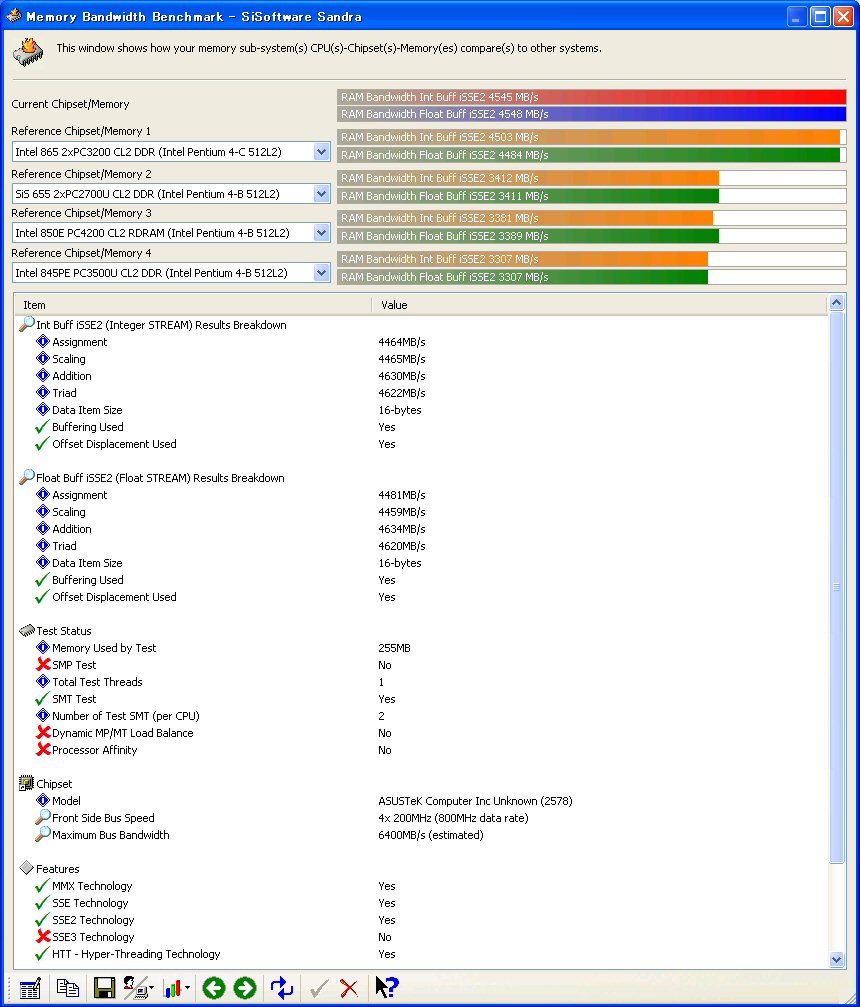
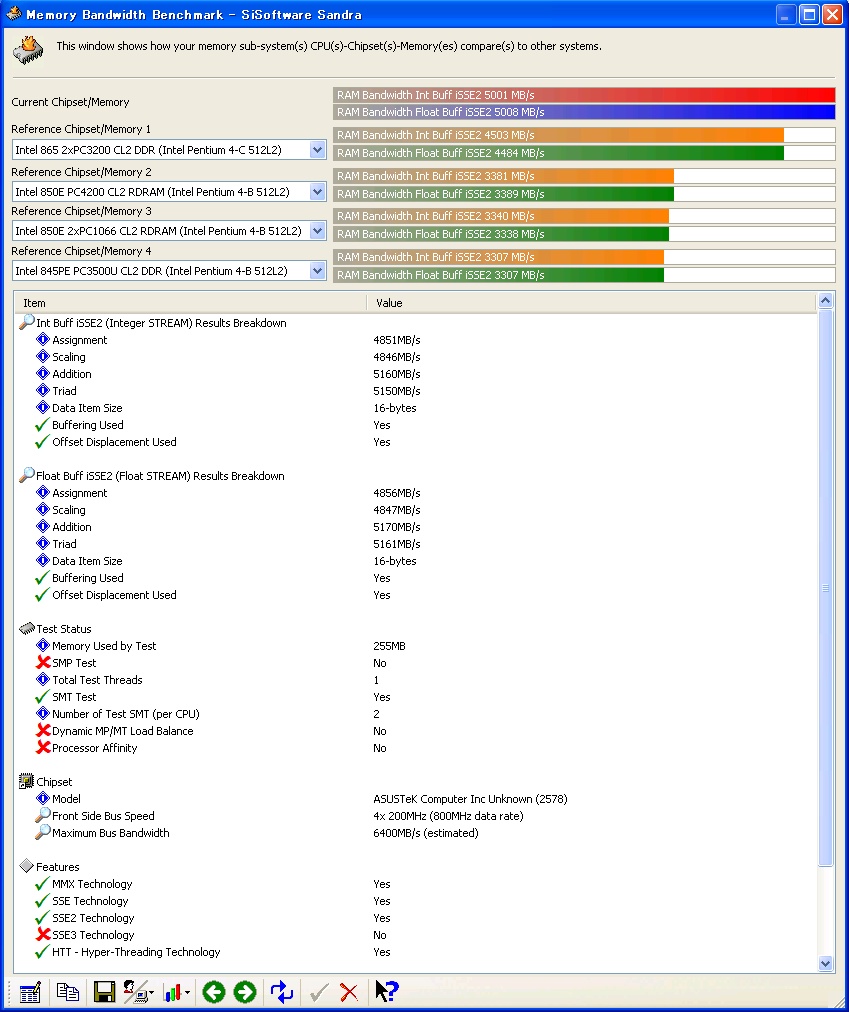
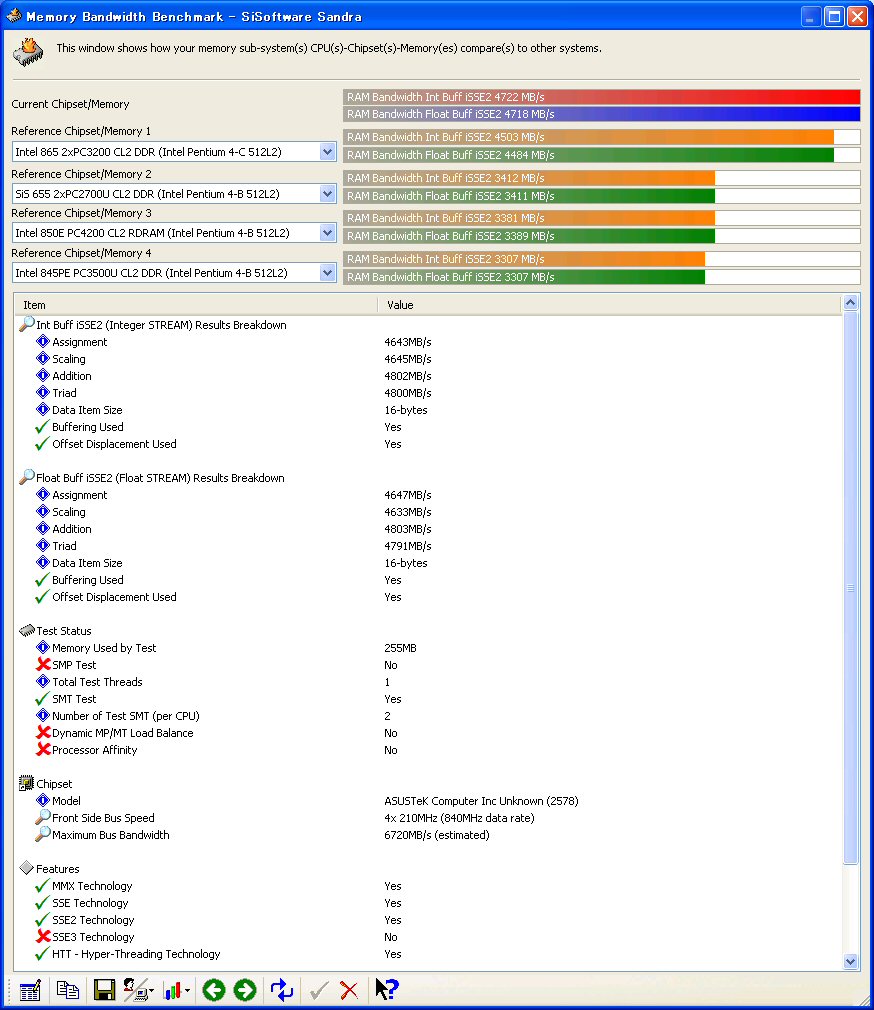
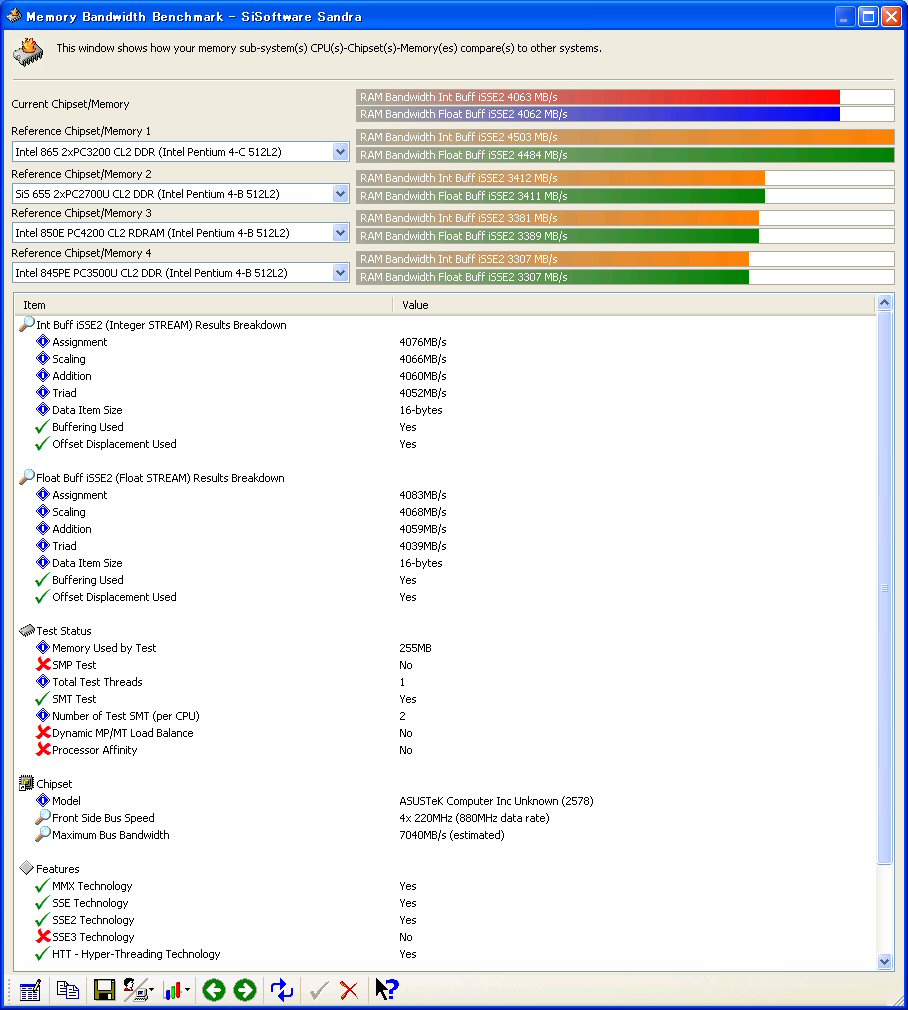
| Int Buff iSSE2 (MB/s) | 4472 | 4479 | 4545 | 5024 | 5001 | 4722 | 4788 | 5071 | 4807 | 4063 | 4635 |
| Float Buff iSSE2 (MB/s) | 4470 | 4480 | 4548 | 5016 | 5008 | 4718 | 4779 | 5073 | 4804 | 4062 | 4582 |
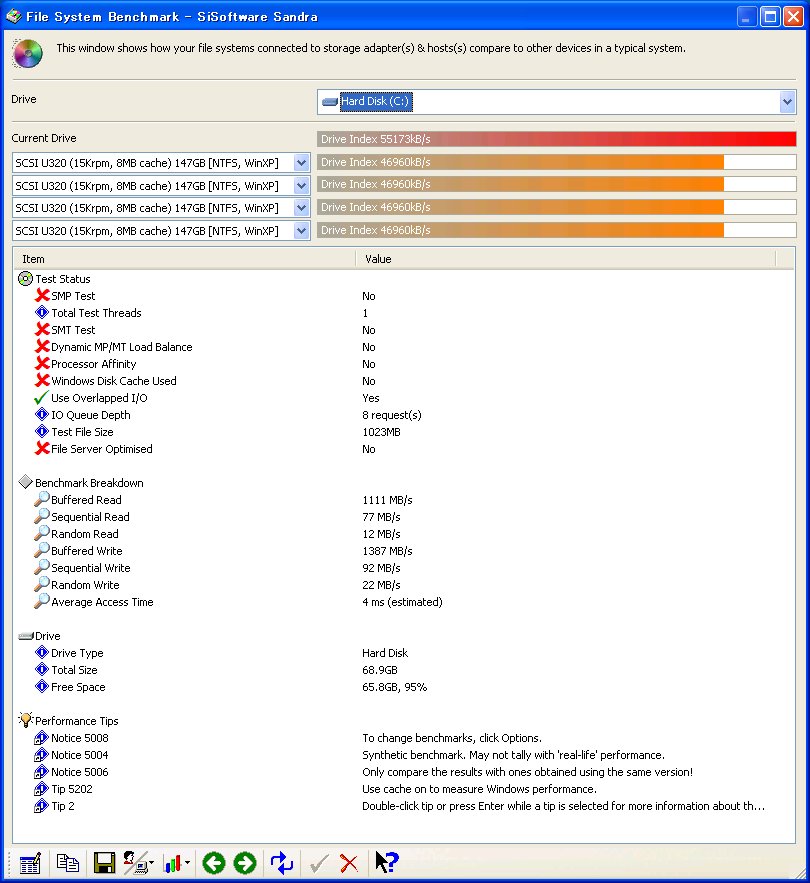
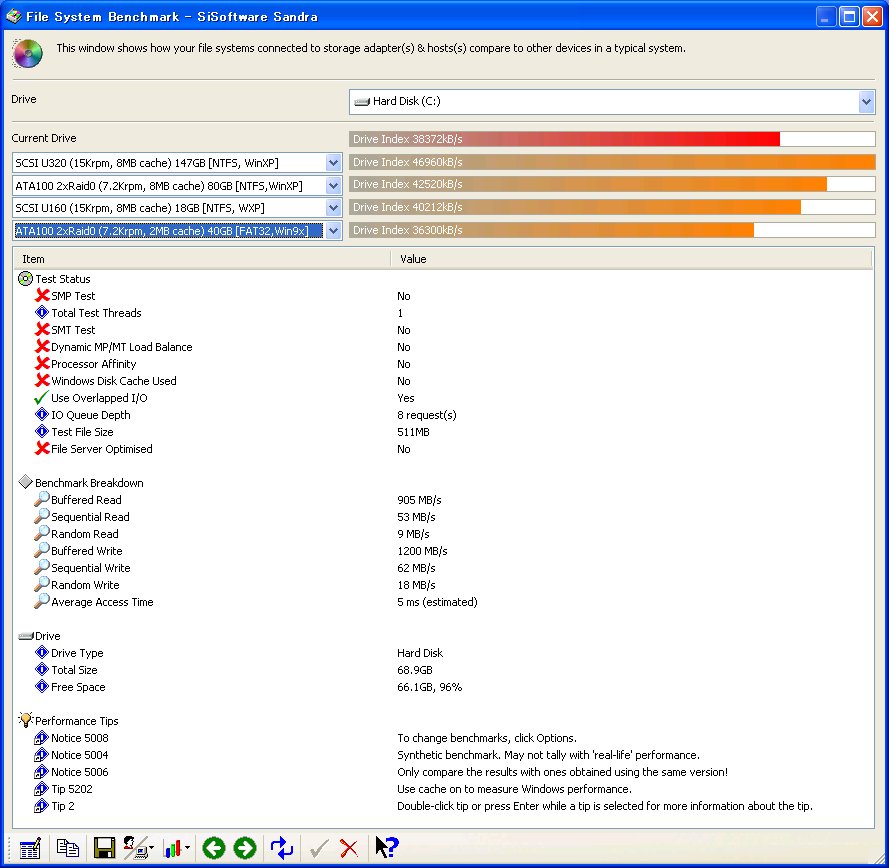
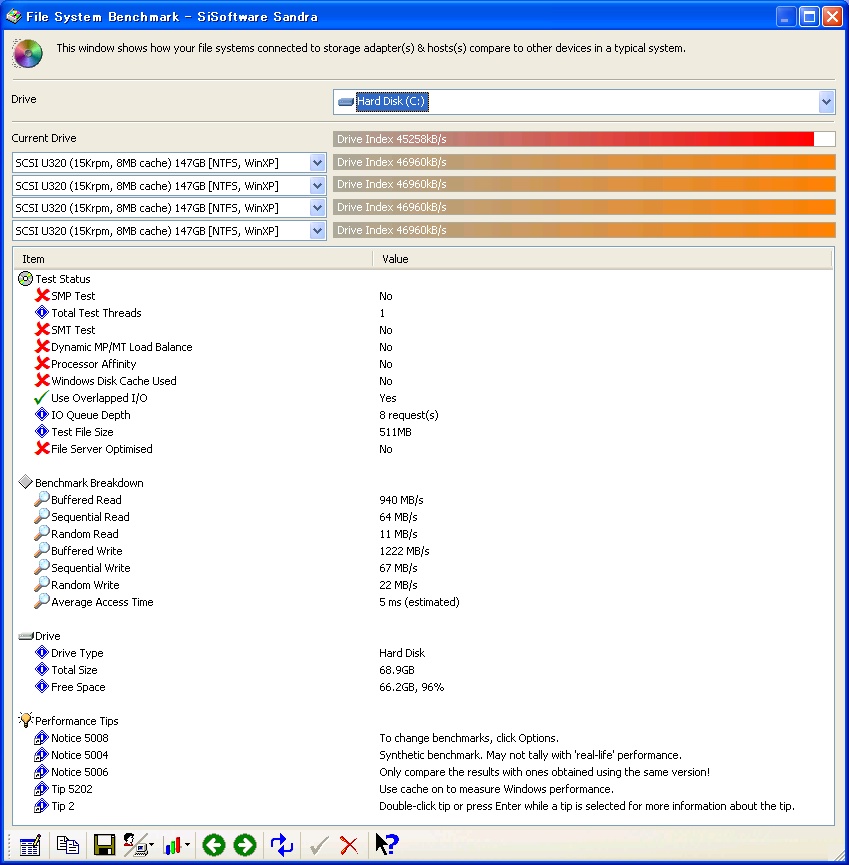
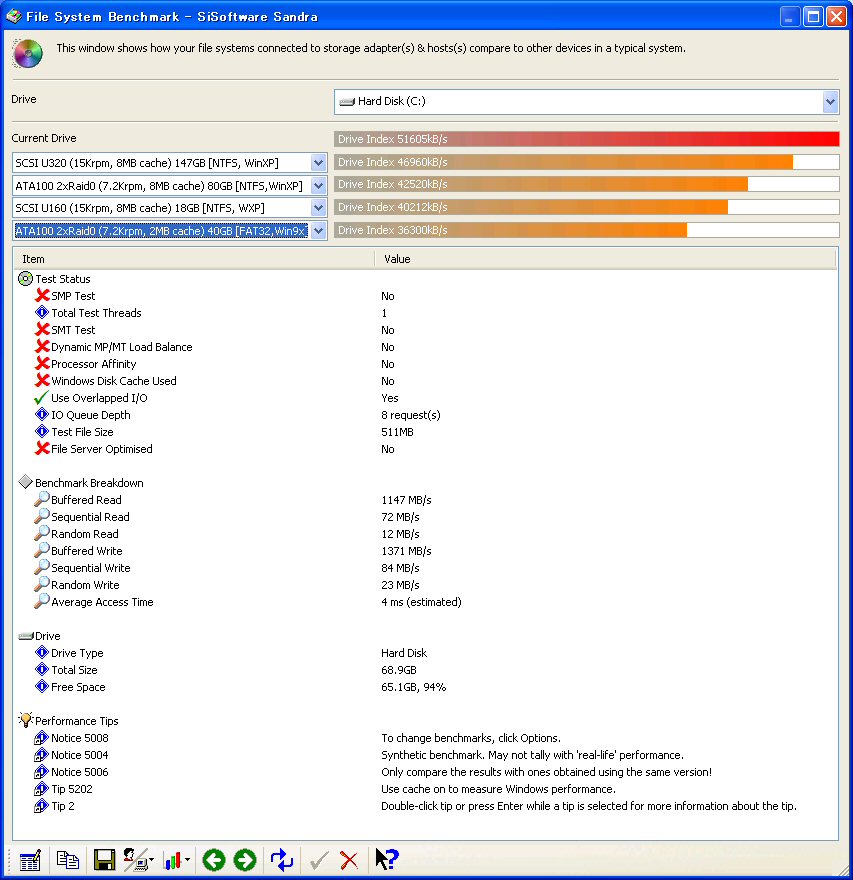
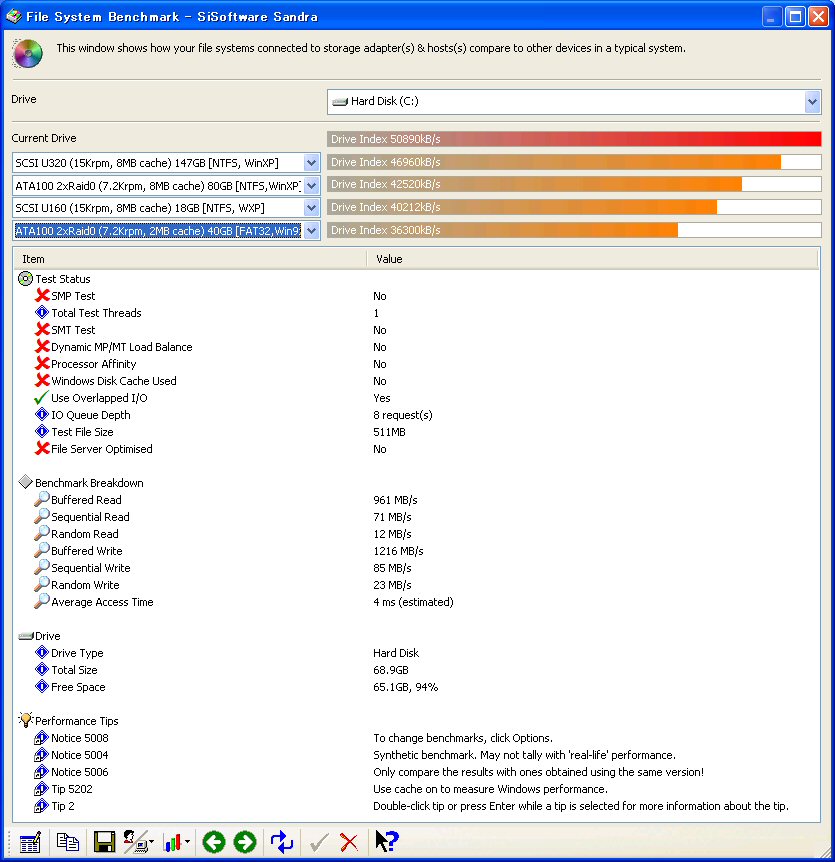
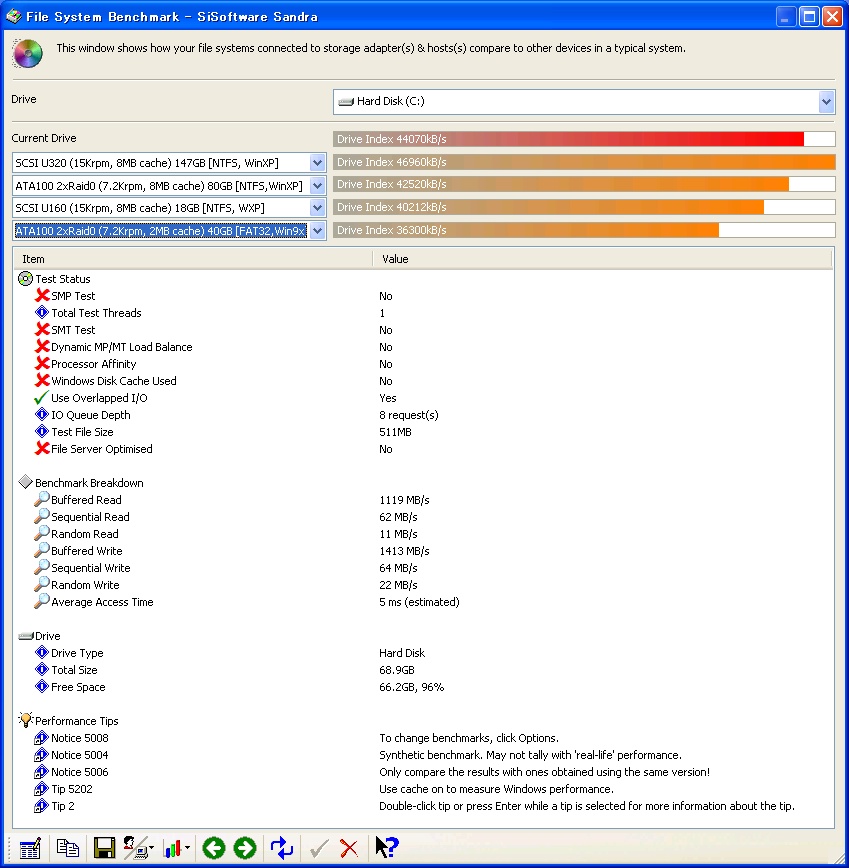
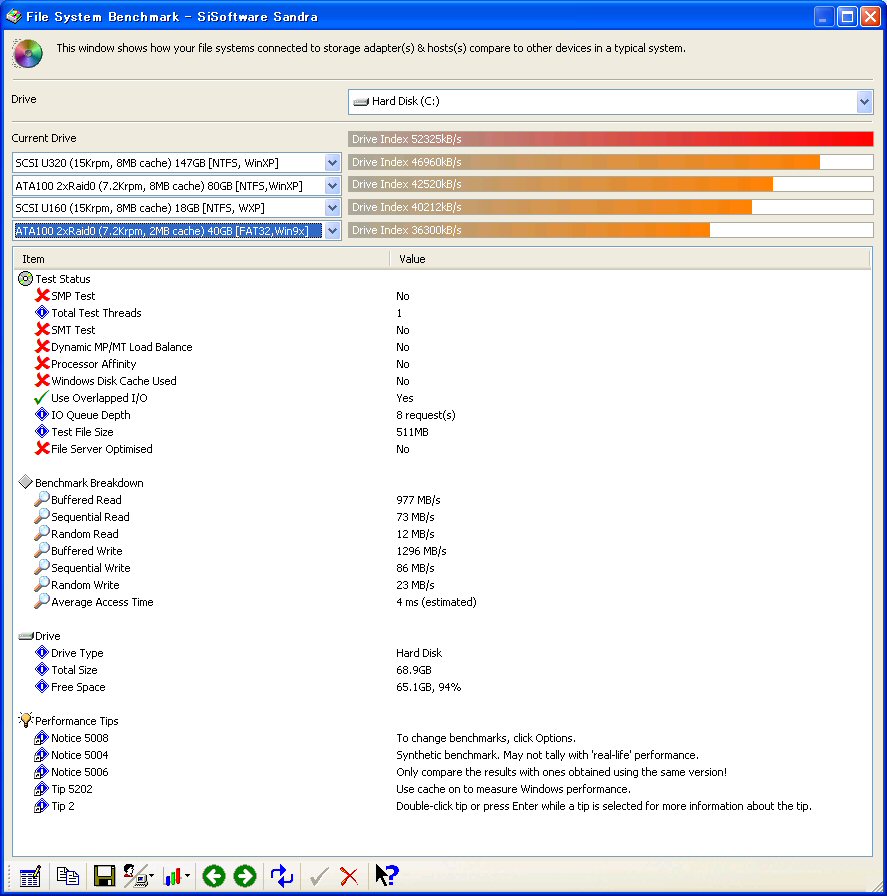
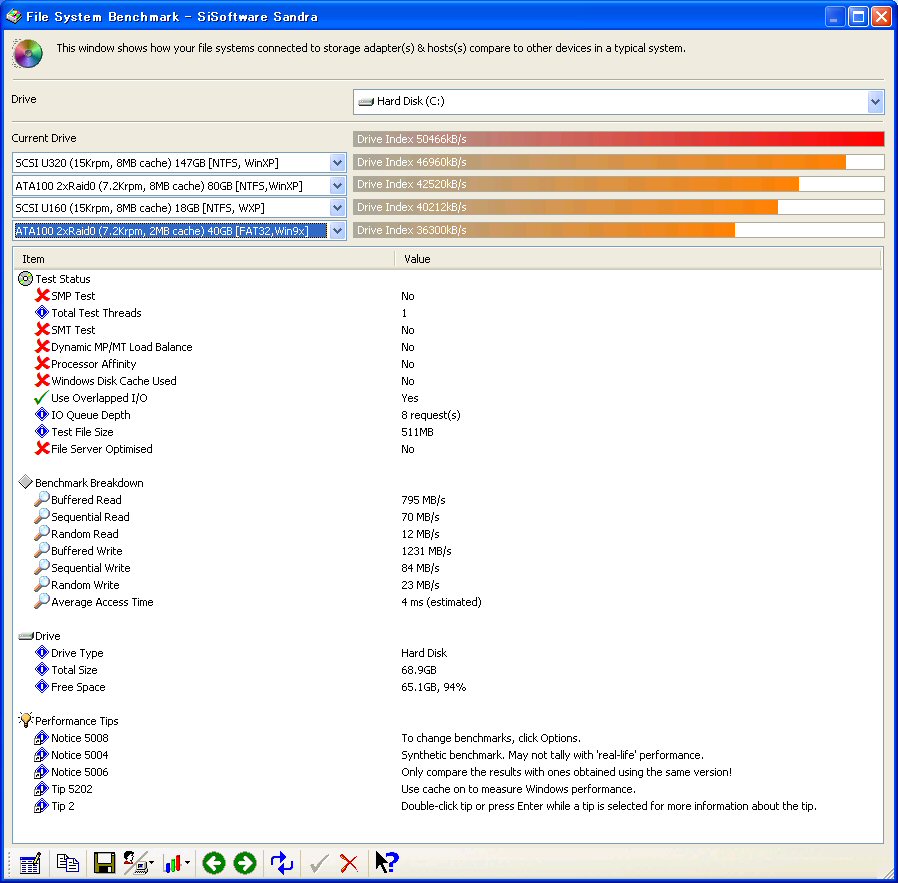
| Drive Index (kB/s) | 38372 | 45258 | 50890 | 51605 | 44070 | 52325 | 52019 | 51383 | 57781 | 50466 | 55173 |
| Buffered Read (MB/s) | 905 | 940 | 961 | 1147 | 1119 | 977 | 1007 | 1012 | 1011 | 795 | 1111 |
| Sequential Read (MB/s) | 53 | 64 | 71 | 72 | 62 | 73 | 73 | 72 | 84 | 70 | 77 |
| Random Read (MB/s) | 9 | 11 | 12 | 12 | 11 | 12 | 12 | 12 | 12 | 12 | 12 |
| Buffered Write (MB/s) | 1200 | 1222 | 1216 | 1371 | 1413 | 1296 | 1269 | 1356 | 1329 | 1231 | 1387 |
| Swquential Write (MB/s) | 62 | 67 | 85 | 84 | 64 | 86 | 85 | 85 | 84 | 84 | 92 |
| Random Write (MB/s) | 18 | 22 | 23 | 23 | 22 | 23 | 23 | 23 | 23 | 23 | 22 |
| Average Access Time (ms) | 5 | 5 | 4 | 4 | 5 | 4 | 5 | 4 | 5 | 4 | 4 |
| MovieMaker2 | 386 | ||||||||||
| WindowsMediaEncorder | 1762 | ||||||||||
| Ulead VideoStudio7 | 356 | ||||||||||
P4-3.2C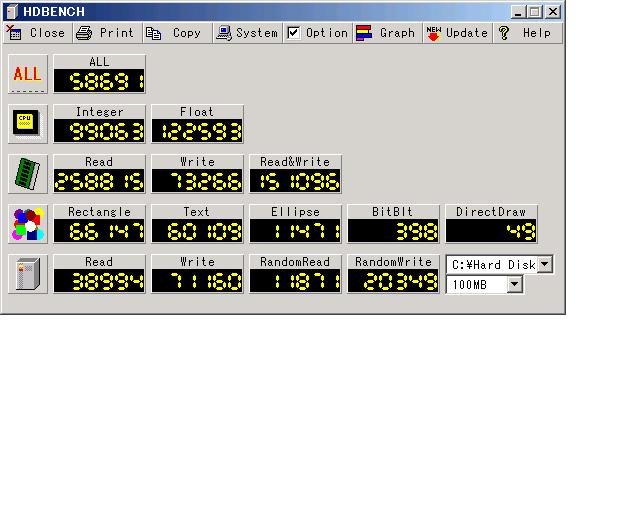
|

|
|
|
P4-2.8C BIOS ver1006 |
|
|
|
P4-2.8C BIOS ver1010 with FastTeck driver update |
|

|
|
p4-2.8 BIOS ver1010 with FastTeck driver update & Turbo only |
|


|
|
p4-2.8 BIOS ver1010 with FastTeck driver update & Peformance Mode only |
|
|
|
p4-2.8 BIOS ver1010 with FastTeck driver update & Turbo & Performance Mode |
|
|
|
p4-2.8(OC2.94GHz) BIOS ver1010 with FastTeck driver update |
|
|
|
p4-2.8(OC3.08GHz) BIOS ver1010 with FastTeck driver update |
|
|